New-user analytics
Read new-user counts, trends and available source or profile breakdowns.
Open Analytics and select the account and date range you want to review. Find the New Users panels and check which breakdowns are available for the connected channel.
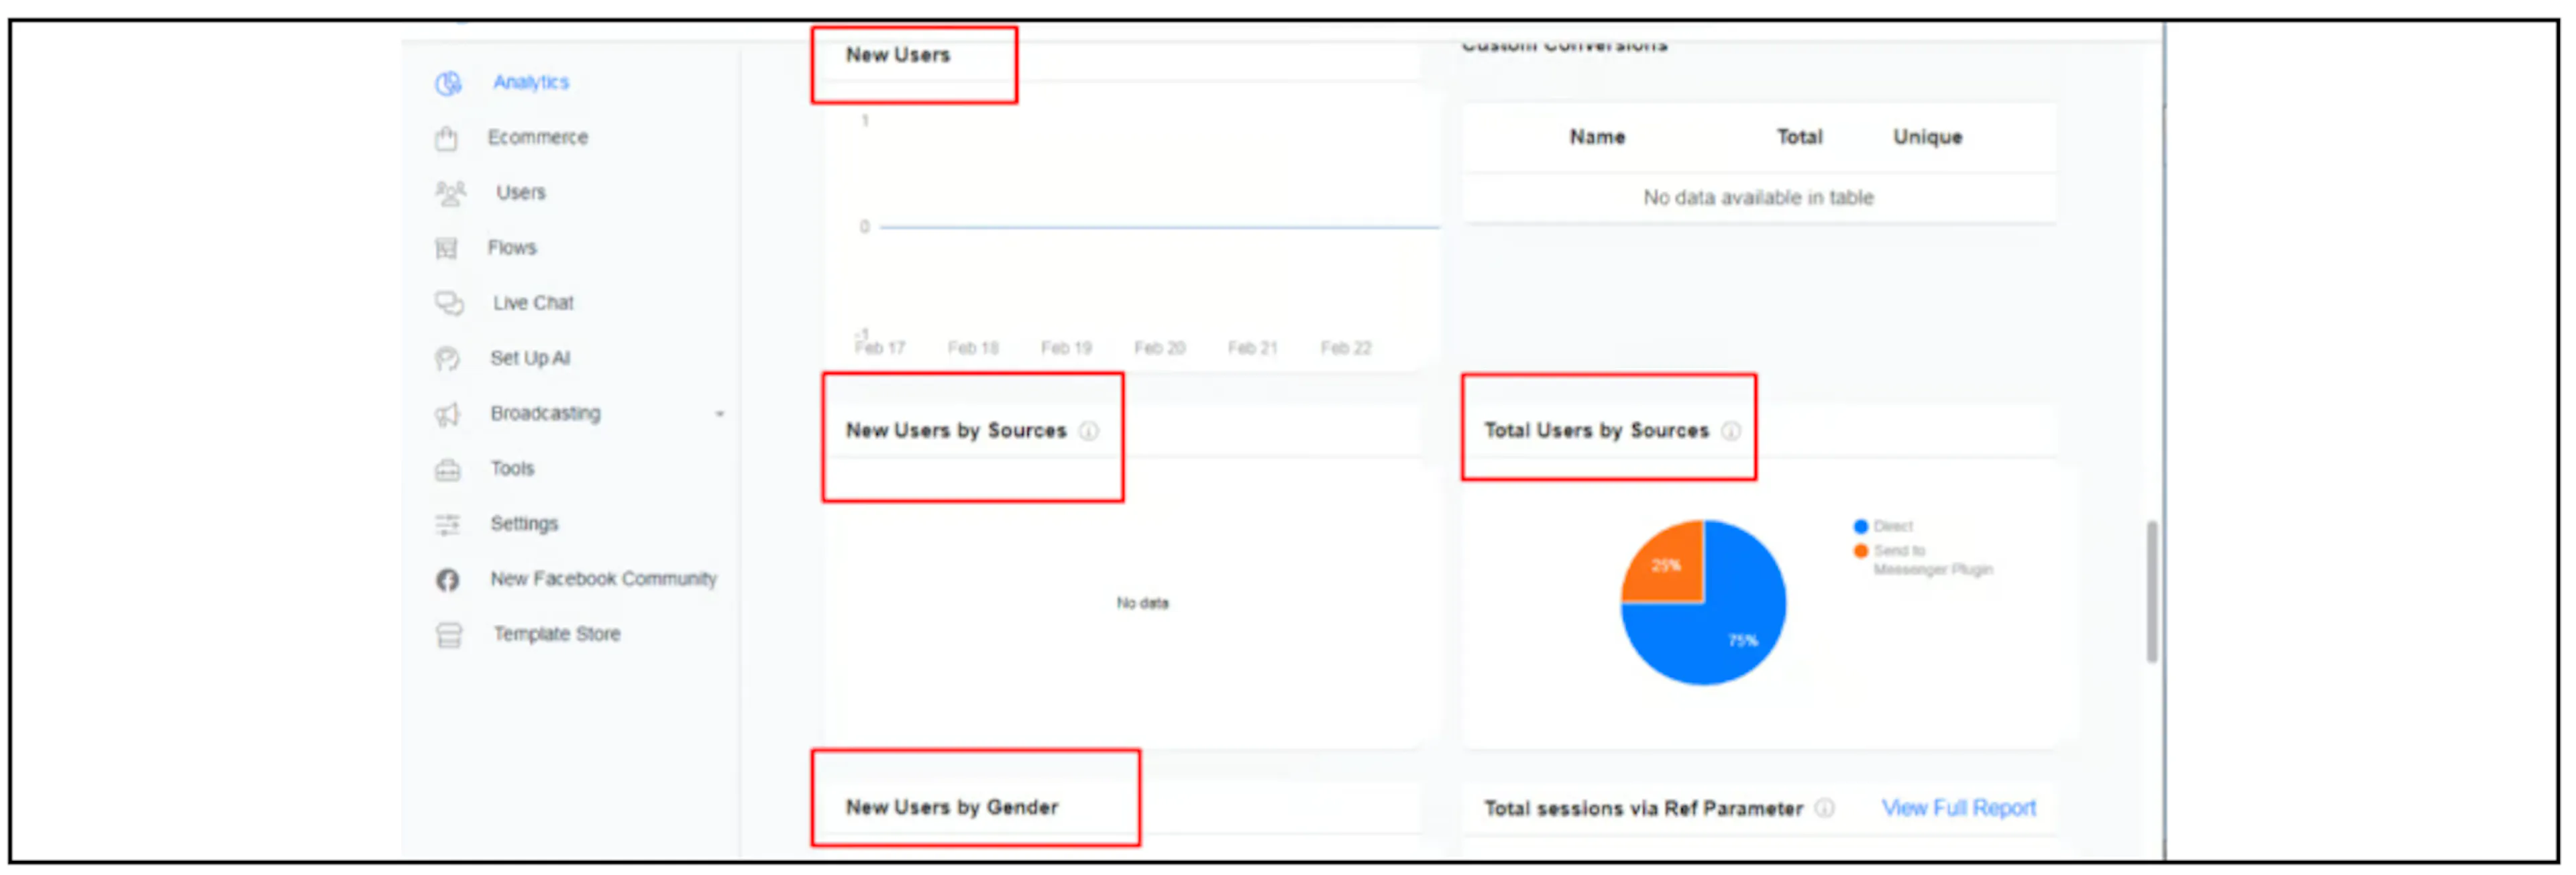
Read the panels
| Panel | What to check |
|---|---|
| New Users count | The displayed number of new users for the selected period. Confirm the comparison period used by any percentage change. |
| New Users graph | How the reported count changes over the dates on the horizontal axis. |
| New Users by Sources | The reported source categories for new users. Confirm how Bual Pro assigns these labels before using them for attribution. |
| New Users by Gender, when available | The breakdown for contacts with available profile data. It may be incomplete or absent for a channel. |
| Language breakdown, when available | The language information the connected channel supplies. Confirm what the field represents before treating it as a customer's preferred language. |
The screenshot includes Total Users by Sources beside New Users by Sources. Read the panel title carefully; totals and new-user counts are different measures.
Compare periods carefully
Use consistent date ranges when comparing results. If the interface shows an increase or decrease, confirm the underlying comparison period before describing it as growth.
Check what counts as a new user, which time zone the report uses, and how duplicate or returning contacts are counted. Contact support if those definitions affect your report.
Use source and profile data in context
The earlier guide focuses on Messenger subscribers and Facebook-supplied profile data. Availability may differ for WhatsApp or another channel. Missing gender or language data should not be filled in from assumptions.
Confirm how source categories map to acquisition methods before using them to compare campaigns. A dashboard source label alone does not establish which advertisement produced a conversion.